Punchh Insights Weekly Industry Report for July 12
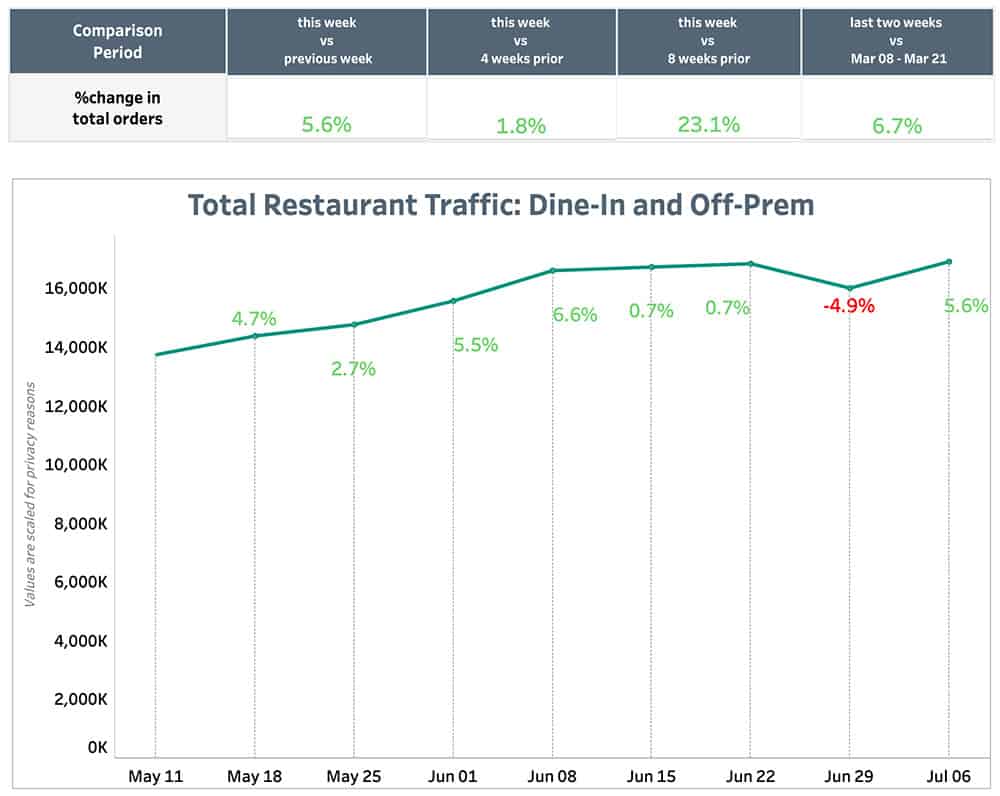
Total Restaurant Traffic
Total Restaurants
Total traffic has increased by 5.6% from the previous week.
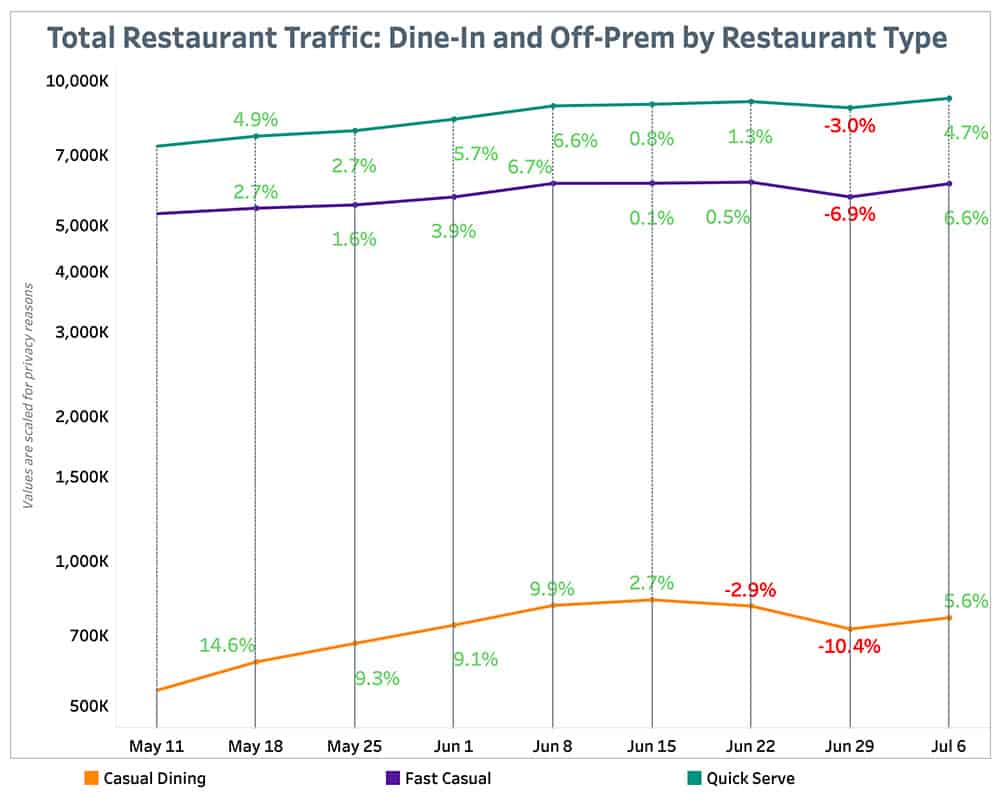
By Restaurant Type
QSR traffic has increased by 4.7% from the previous week.
Fast Casual traffic has increased by 6.6% from the previous week.
Casual Dining traffic has increased by 5.6% from the previous week.
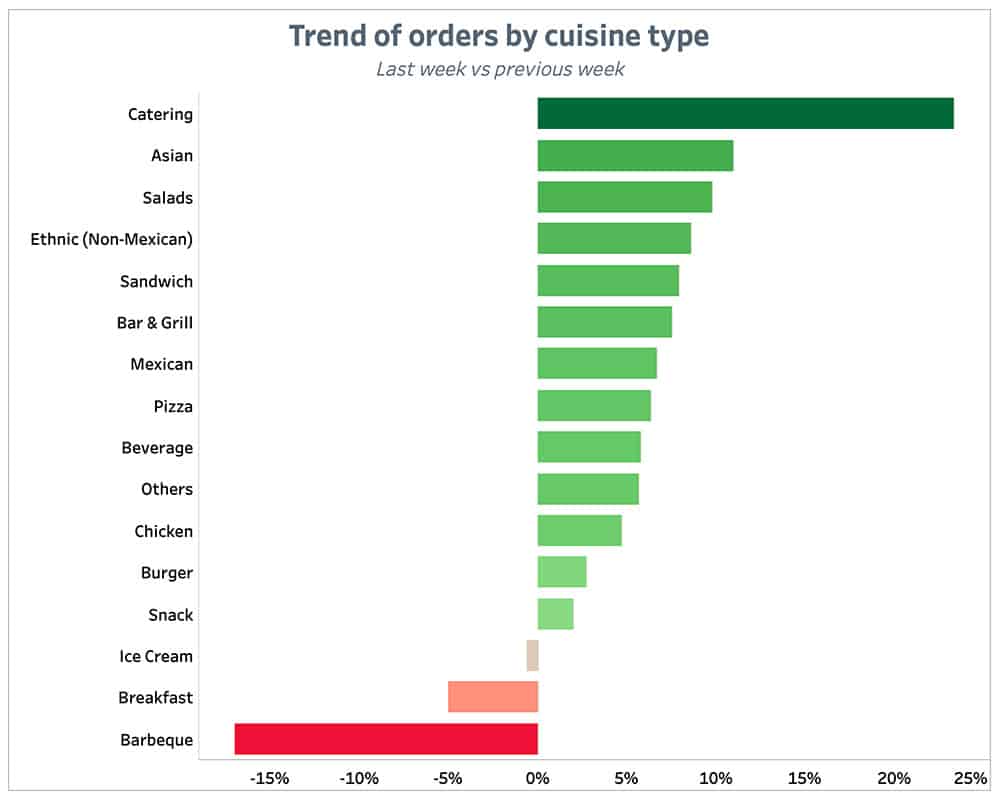
Trend of Orders by Cuisine Type
Last Week vs Previous Week
Catering has seen the highest increase in orders from the previous week (24%).
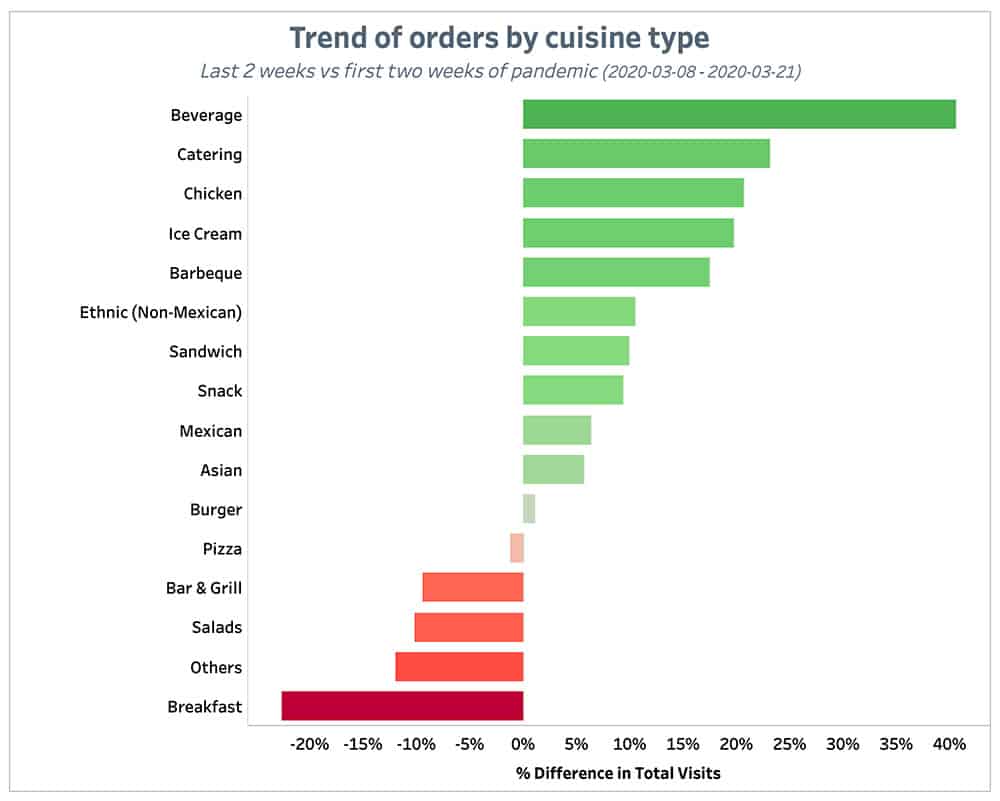
Last 2 Weeks vs Pre-COVID
Breakfast has seen the highest decrease in orders in last two weeks from two weeks of start of pandemic (-22%) while Beverages have increased to 40%.
Trend of Orders by Region
Last Week vs Previous Week
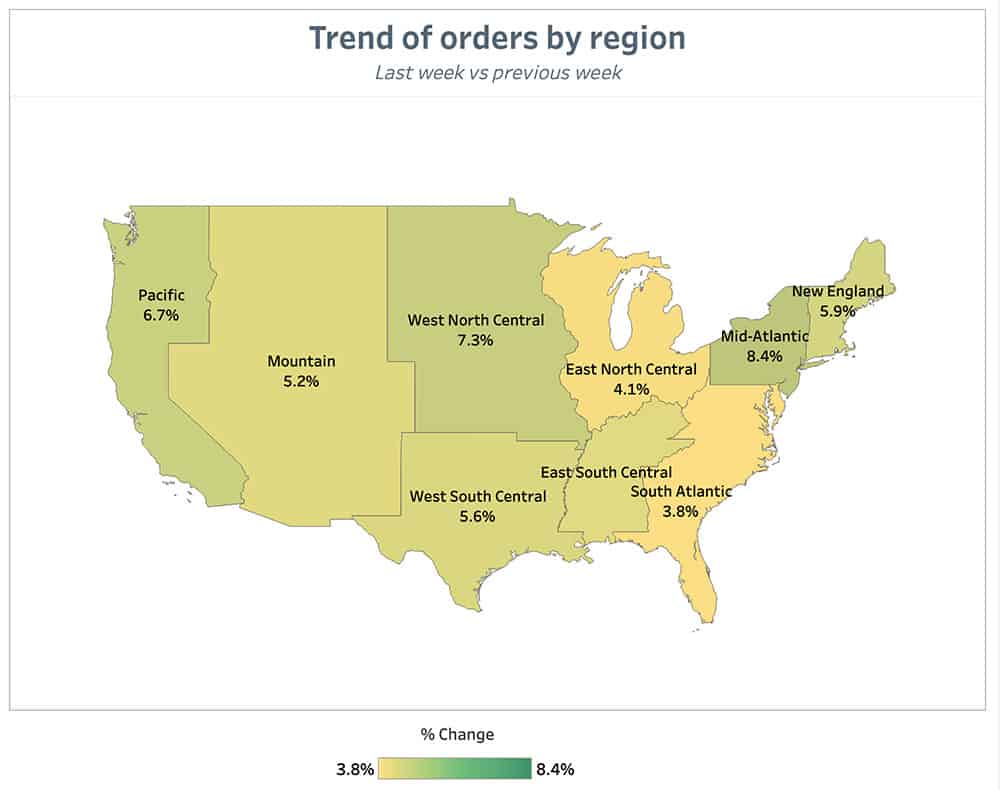
The Mid-Atlantic Region has seen the highest increase in orders from the previous week (8.4%).
Last 2 Weeks vs Pre-COVID
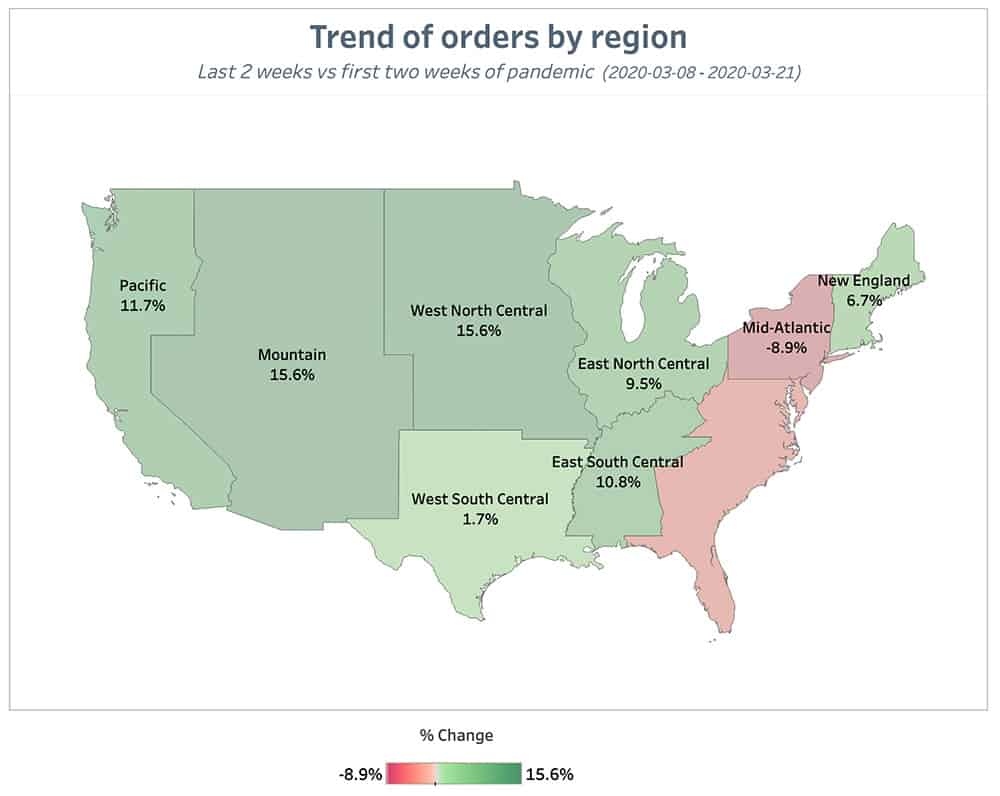
The Mountain Region and West North Central have seen the highest increase in orders from two weeks of start of pandemic (15.6%) while the Mid-Atlantic Region has seen the highest decrease in orders (-8.9%).
Loyalty Trends
Loyalty Orders as % of Total Restaurant Traffic
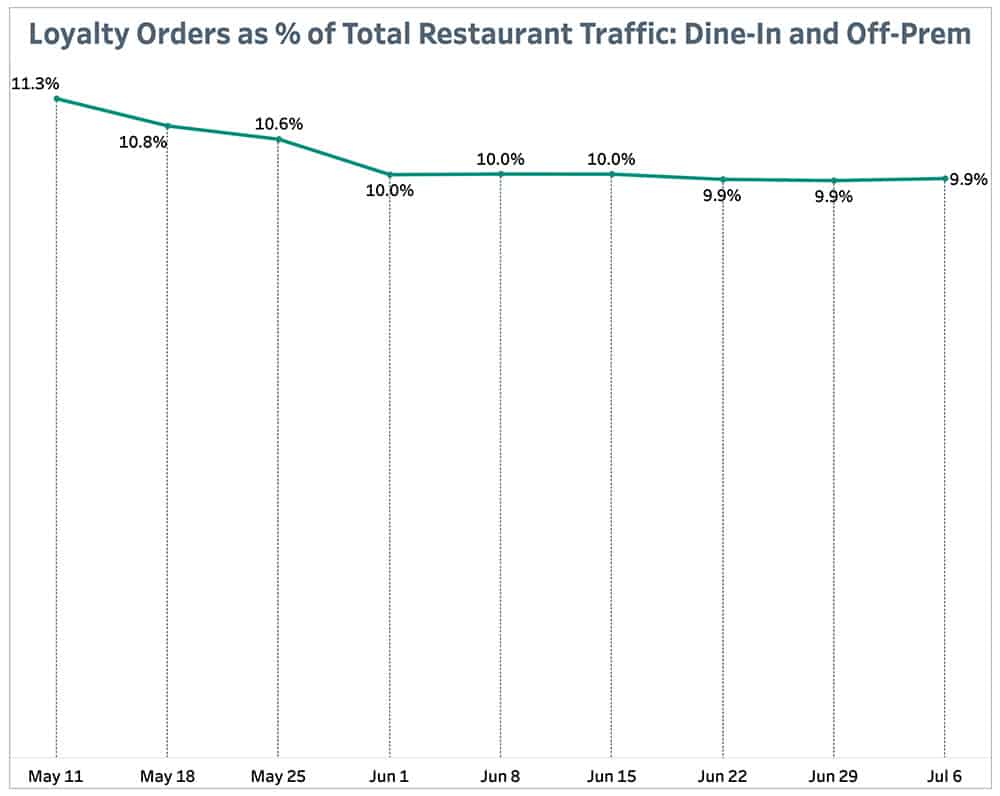
Loyalty Participation remained unchanged this week at 9.9%.
AOV Loyalty Orders vs Total Restaurant Traffic
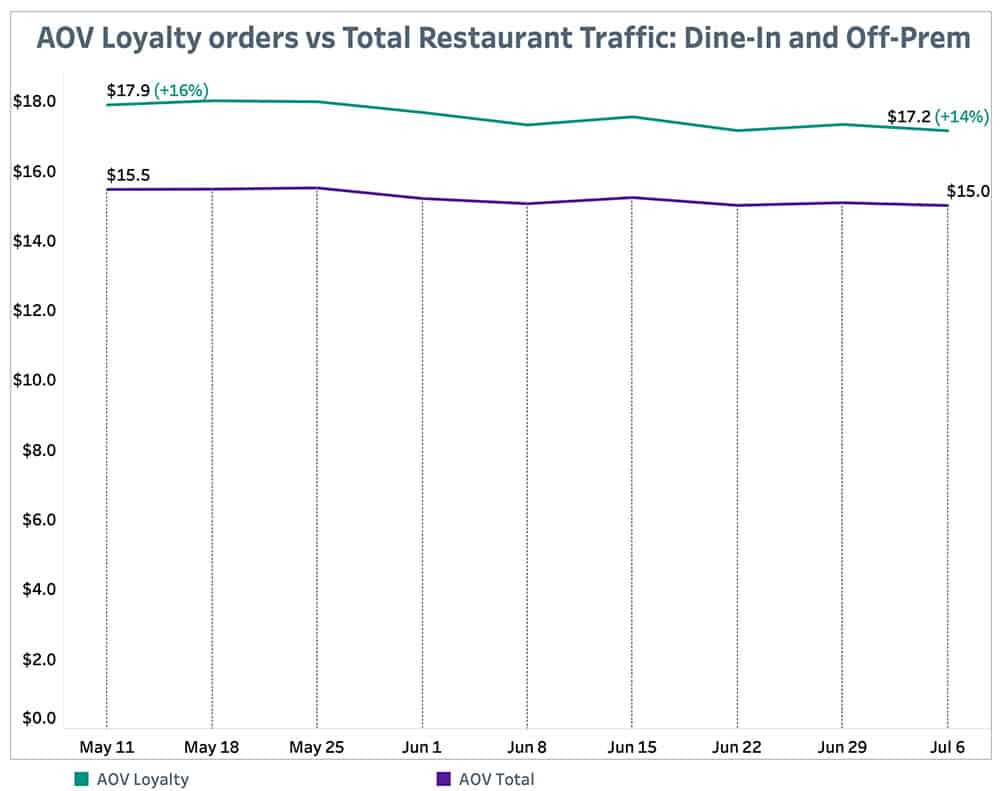
Loyalty average order value remains on higher side when compared with Total average order value with a 14% difference in last week.
Online Orders as % of Loyalty Orders
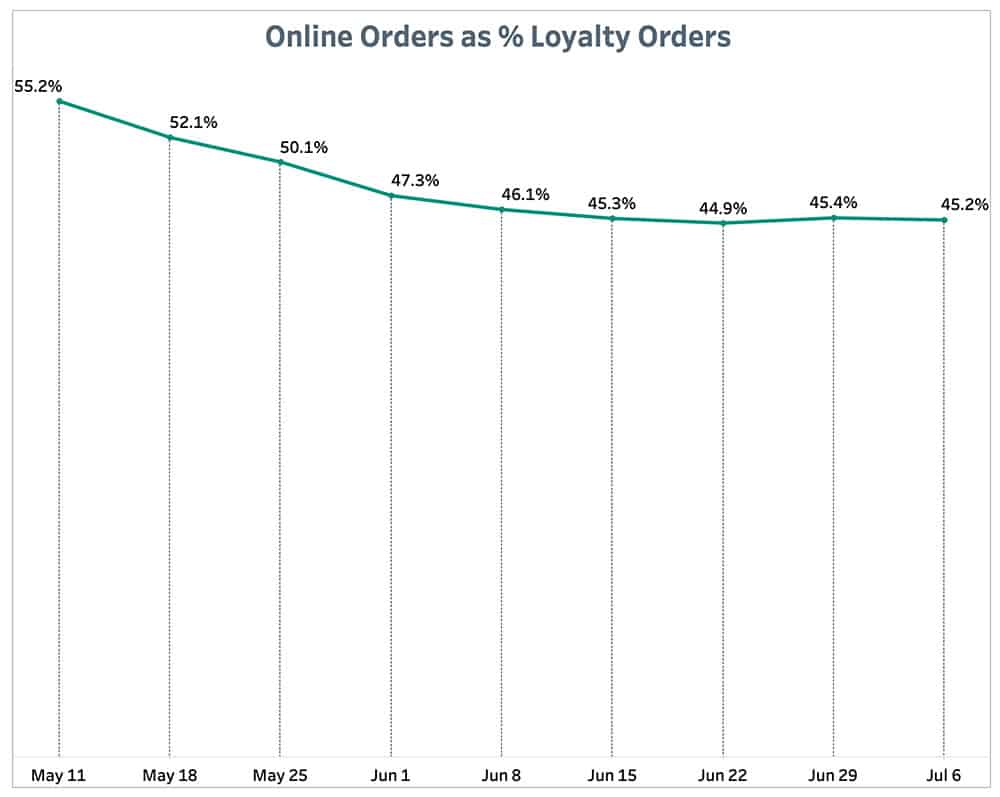
Online orders as a % of total orders is at 45.2%, a .2% decrease from last week.
Consumer Preferences
Total Restaurant Traffic: Dine-In and Off-Prem by Daypart
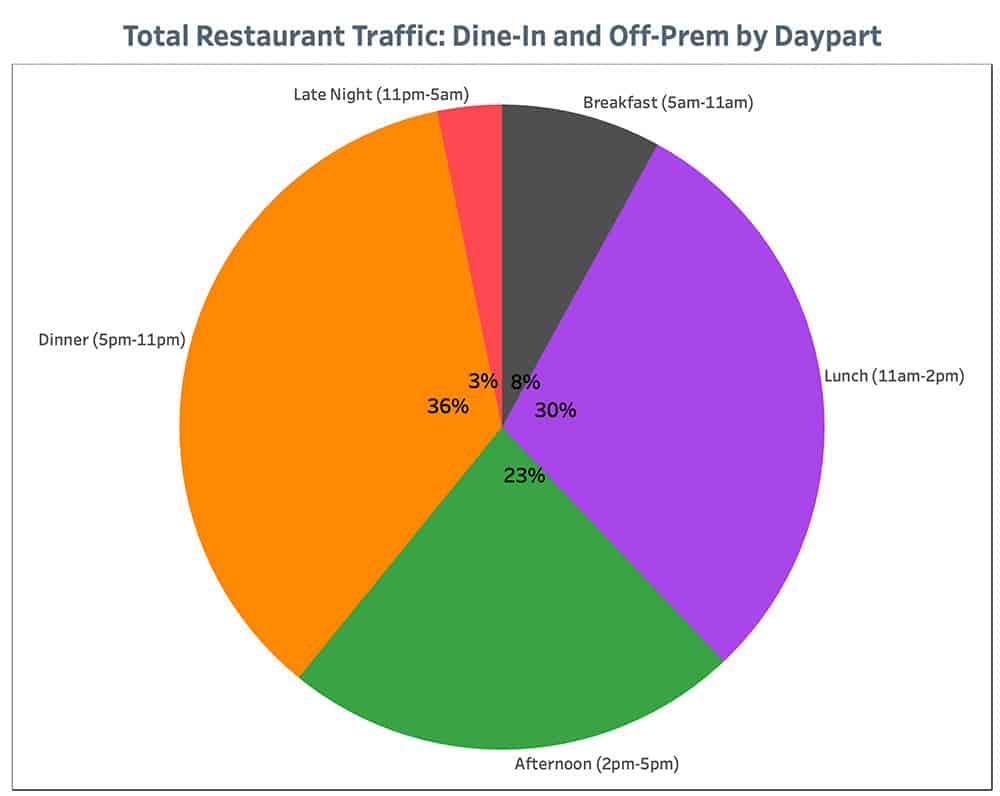
Dinner (5pm-11pm) is still the most popular Daypart at 36%.
About the data:
The underlying data for this analysis is from 100+ brands over the last 9 weeks.